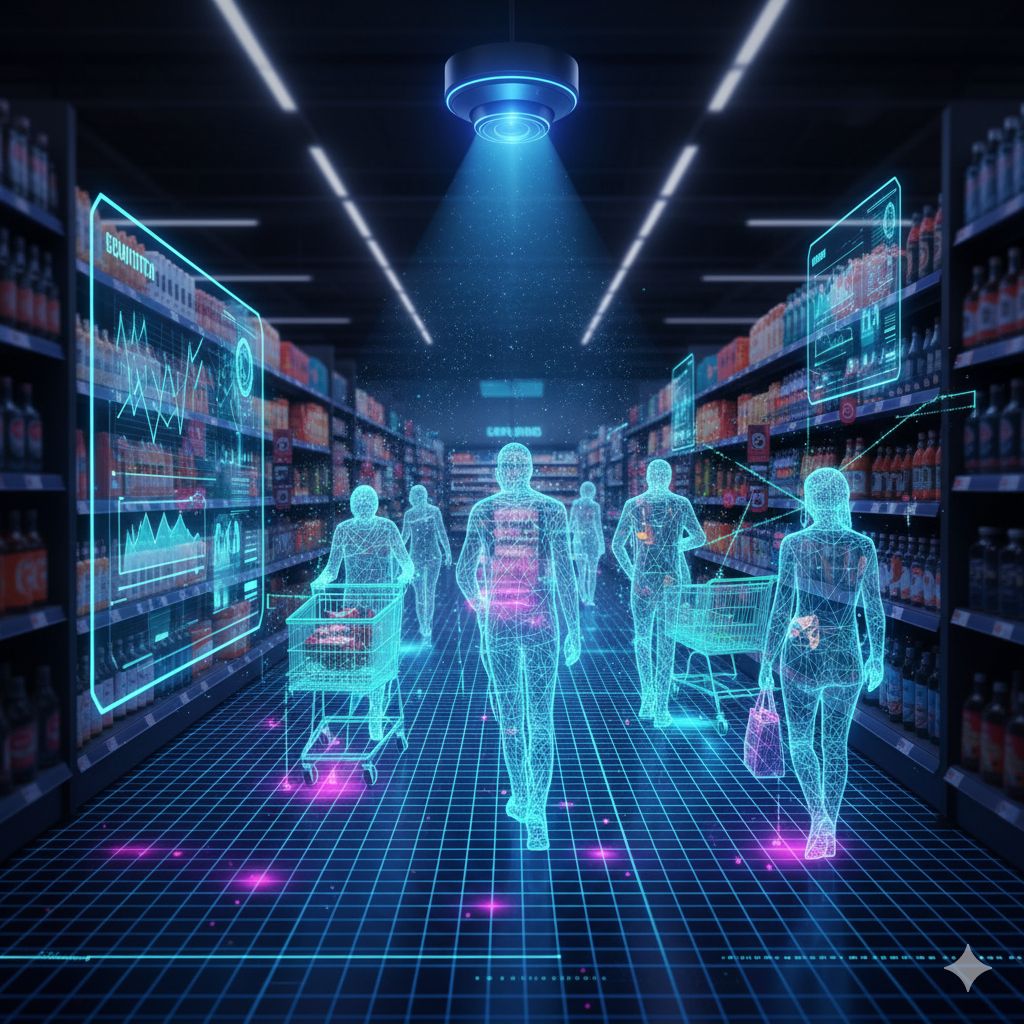
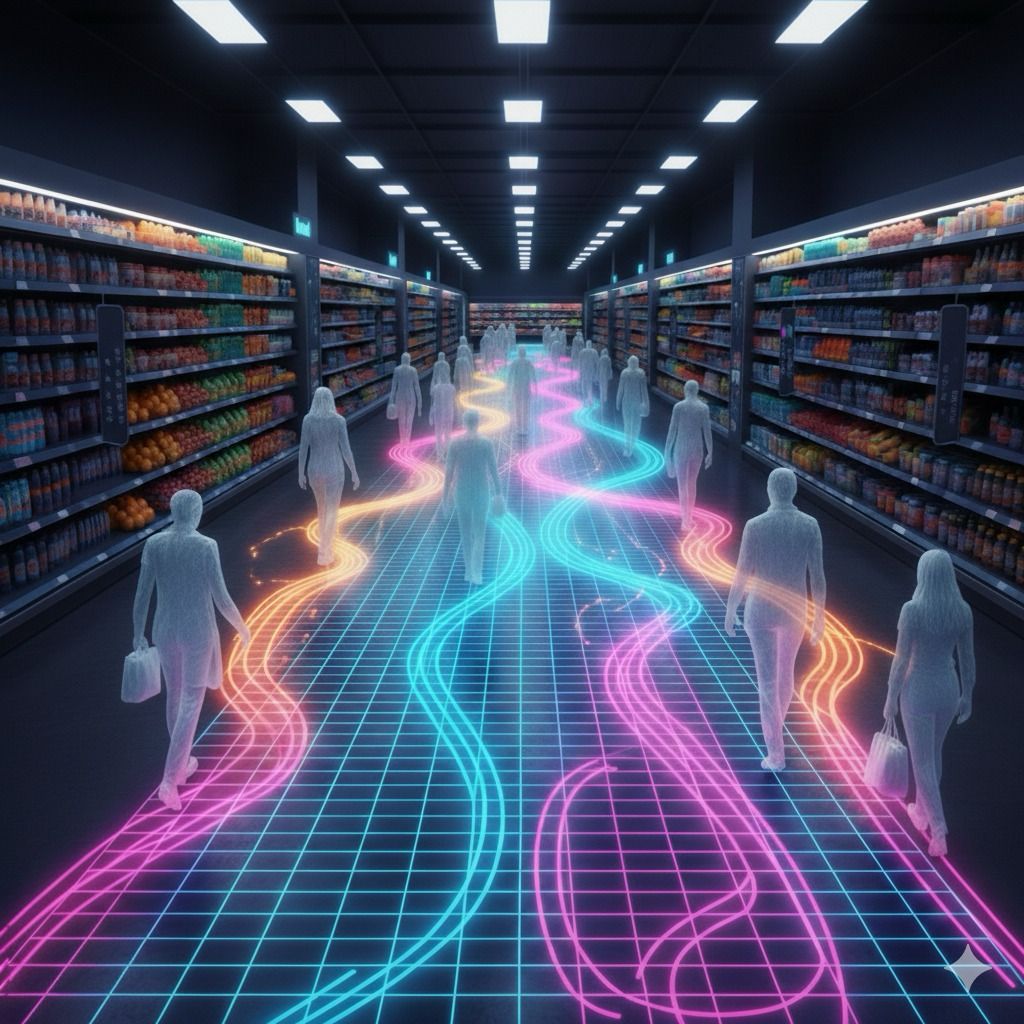
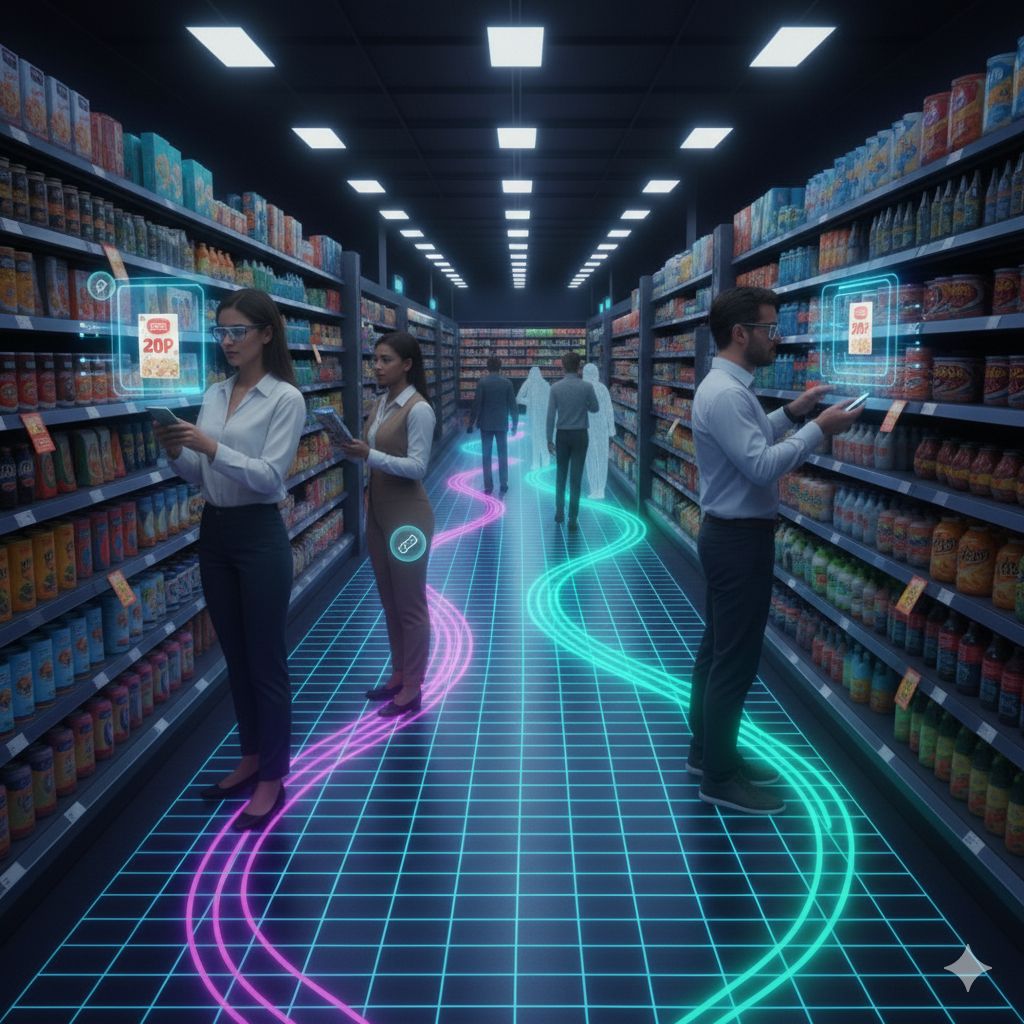
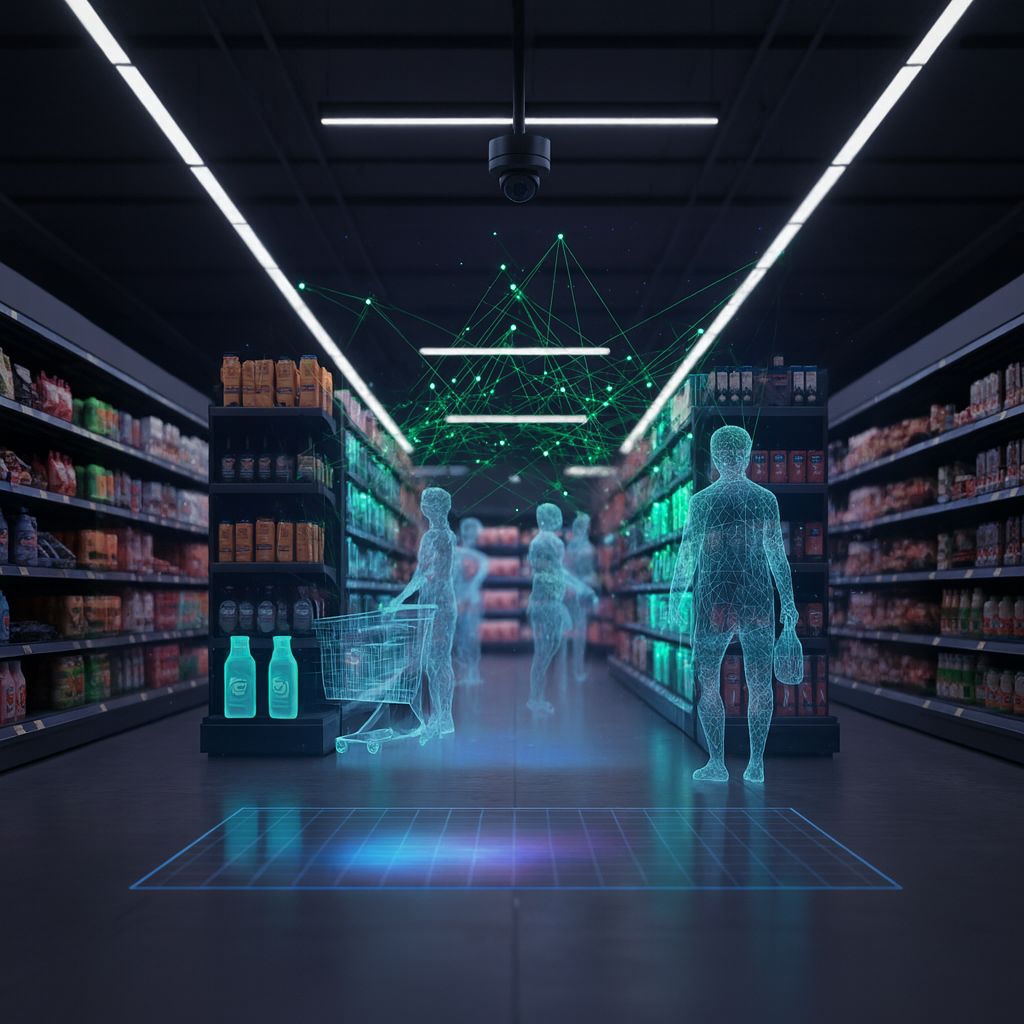
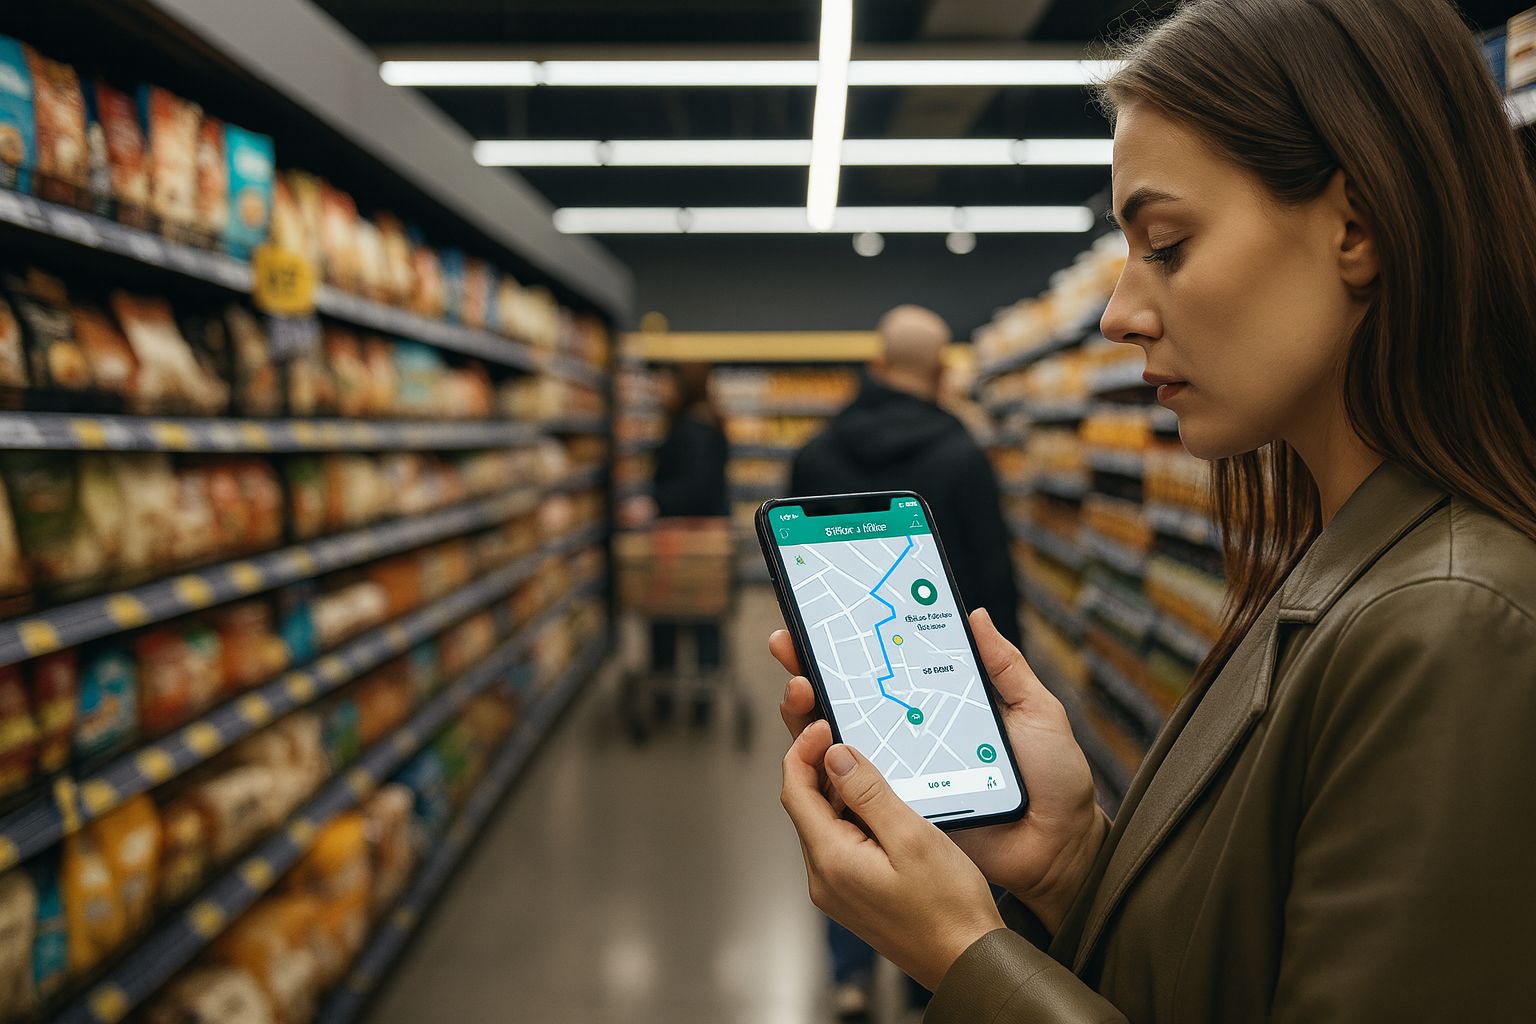
At DriverAI, we are transforming the in-store shopping experience with cutting-edge Precision Navigation, AI, and Computer Vision technologies.
Our mission is to eliminate the frustration of navigating large retail spaces by bringing indoor mapping technology directly to shoppers' smartphones. By providing seamless navigation to specific products and offering personalized recommendations, DriverAI enhances the shopping experience, making it more convenient, efficient, and enjoyable.
For retailers, DriverAI provides a powerful data-driven advantage. Unlike traditional systems that require costly infrastructure, our solution offers a cost-effective, highly accurate approach to indoor navigation and customer engagement. By gaining access to real-time insights into customer behavior and movement patterns, retailers can optimize store layouts, improve customer interactions, and boost overall sales.
Discover the powerful tools that make DriverAI the leading solution for retail navigation and analytics.
Revolutionizes in-store navigation with immersive 3D maps. Shoppers can instantly visualize store layouts and locate products from their smartphone.
Visualizes customer activity and inventory data in real-time. Identifies peak zones and areas needing attention for optimized store layouts.
Analyzes inventory trends and tracks products, revenue, and stock levels. Provides comprehensive overview with real-time analytics and forecasting.
Provides insights into customer behavior, demographics, and shopping patterns. Tracks live visitors, session times, and conversion rates.
Empowers stores to create and analyze in-store ad campaigns with ease. Manages campaigns with calendar view and performance analytics.
The 3D technology dashboard revolutionizes in-store navigation by providing an immersive, interactive 3D map of your retail environment. Shoppers can instantly visualize the store layout, locate specific products, and plan their route—all from their smartphone or in-store kiosk. The 3D interface makes it easy to explore aisles, departments, and product locations in a way that's intuitive and visually engaging.
For retailers, this technology offers powerful insights into customer movement, popular paths, and high-traffic zones. It enables you to optimize store layouts, improve product placement, and enhance the overall shopping experience. With 3D technology, navigating large retail spaces becomes seamless, efficient, and even enjoyable for every customer.
Interactive Demo
The activity heatmap is a powerful analytics tool that visualizes customer activity and inventory data within your retail store. By leveraging real-time data, it highlights peak activity zones, average customer traffic, and areas that require attention, such as low stock or high demand. The heatmap enables you to quickly identify trends, optimize store layouts, and improve customer engagement by providing actionable insights into how shoppers move and interact within your space.
With customizable variables like customer traffic, product interactions, sales density, and inventory velocity, the activity heatmap gives you a comprehensive view of your store's performance. Use it to make data-driven decisions, enhance the shopping experience, and drive business success—all with an intuitive, easy-to-use interface.

Interactive Demo

Interactive Demo
The activity heatmap is a powerful analytics tool that visualizes customer activity and inventory data within your retail store. By leveraging real-time data, it highlights peak activity zones, average customer traffic, and areas that require attention, such as low stock or high demand. The heatmap enables you to quickly identify trends, optimize store layouts, and improve customer engagement by providing actionable insights into how shoppers move and interact within your space.
With customizable variables like customer traffic, product interactions, sales density, and inventory velocity, the activity heatmap gives you a comprehensive view of your store's performance. Use it to make data-driven decisions, enhance the shopping experience, and drive business success—all with an intuitive, easy-to-use interface.
The inventory dashboard enables retail stores and brands to analyze trends in inventory and items stocked in the store. It provides a comprehensive overview of total products, revenue, low stock items, and inventory value, helping you track, manage, and forecast your inventory and orders. With real-time analytics, you can monitor category distribution, revenue trends, stock levels, and top products by revenue.
The dashboard also allows you to build custom reports and graphs, set up automatic notifications for low stock or high demand, and gain actionable insights to optimize your supply chain. By leveraging these insights, you can improve stock management, reduce out-of-stock situations, and make data-driven decisions to boost sales and operational efficiency.

Interactive Demo
The consumer analytics dashboard provides advanced insights into customer behavior, shopping patterns, and demographics within your retail environment. It tracks key metrics such as live visitors, session times, conversion rates, and total sessions, giving you a real-time view of store activity. Dive deeper with analytics on age distribution, gender split, customer loyalty, shopping times, visit frequency, and device usage.
The dashboard also features journey mapping, touchpoint analysis, heat zones, predictive insights, and key performance indicators. By leveraging these analytics, you can better understand your customers, optimize store layouts, personalize marketing, and improve the overall shopping experience. Use Consumer Analytics to make data-driven decisions that increase engagement, satisfaction, and sales.

Interactive Demo

Interactive Demo
The consumer analytics dashboard provides advanced insights into customer behavior, shopping patterns, and demographics within your retail environment. It tracks key metrics such as live visitors, session times, conversion rates, and total sessions, giving you a real-time view of store activity. Dive deeper with analytics on age distribution, gender split, customer loyalty, shopping times, visit frequency, and device usage.
The dashboard also features journey mapping, touchpoint analysis, heat zones, predictive insights, and key performance indicators. By leveraging these analytics, you can better understand your customers, optimize store layouts, personalize marketing, and improve the overall shopping experience. Use Consumer Analytics to make data-driven decisions that increase engagement, satisfaction, and sales.
The advertising dashboard empowers retail stores and brands to create, customize, and analyze in-store ad campaigns with ease. Manage your campaigns with a calendar view, monitor performance analytics (impressions, CTR, conversion rate), and preview ads in real time. The dashboard provides smart suggestions for campaign setup, budget allocation, and optimal scheduling to maximize reach and effectiveness.
With detailed insights into campaign performance, geographic reach, and platform impact, you can optimize your advertising strategy, boost engagement, and drive sales. Use the advertising dashboard to ensure your message reaches the right time, all from a single, intuitive interface.

Interactive Demo